UW-Madison’s centrally-supported learning management system Canvas (adopted in 2018) offers a feature called SpeedGrader, which provides convenient and efficient options for responding to student writing. This guide synthesizes material available from Canvas Training Course for Instructors.
I. Background: What is SpeedGrader?
SpeedGrader allows you to view students’ writing assignments, comment on those assignments, and evaluate and grade them. With this tool, you can incorporate and use rubrics to evaluate student work. Students can also use the feature to add comments.
Here’s how to access SpeedGrader: Once you have created a new writing assignment on Canvas, click on that assignment until you see an image on the right-hand side of your screen (as shown to the right).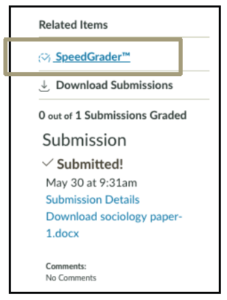
Below is a screenshot of what a student paper looks like in SpeedGrader. You should see a similar page after clicking on the SpeedGrader icon shown to the right.
A Student Paper in SpeedGrader
The paper shown below (from pages 237-238 in the Sourcebook) is from a Sociology course taught by UW-Madison Professor Jim Raymo. On the right side of the page, SpeedGrader provides you with the date and time the student submitted their paper, a place to enter the student’s grade, and a space to leave assignment comments. Note the arrow pointing to the toolbar as well. The DocViewer toolbar features are described later.
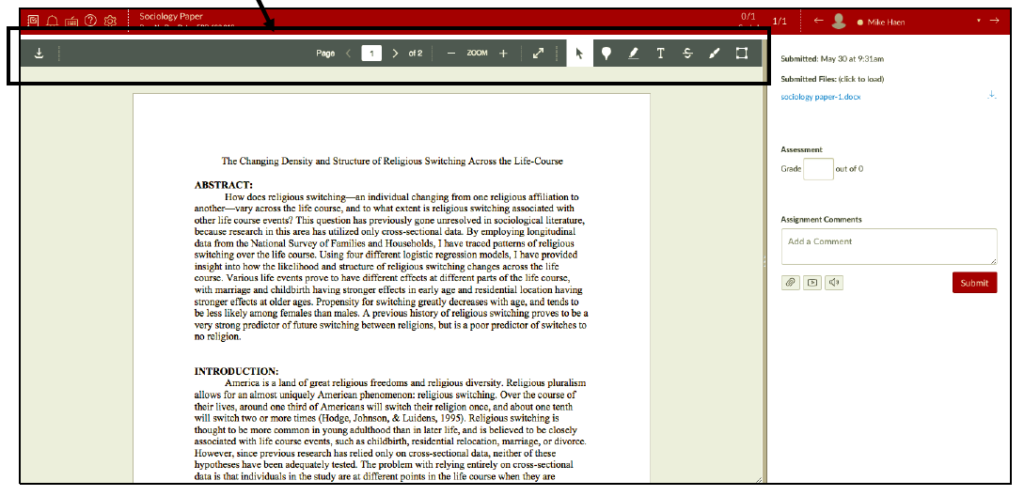
Figure 1: A Student Paper in SpeedGrader
II. Making Written, Audio, and/or Video End Comments
You can use SpeedGrader to give end comments on student papers. In figure 2 to the right, you’ll see several options: (1) the ‘assignment comments’ box where you can write a comment, (2) the ‘file attachment’ option which can be used to submit your comments in a PDF or Word Document copy of the students’ submission, (3) a ‘media comment’ option, and (4) a ‘speech recognition’ commenting option.
When submitting a media comment (#3), you can choose to record/upload a comment. You will need the latest version of Adobe flash player to do this. With speech recognition (#4), you can record your spoken comments and those comments will be transcribed automatically.
III. Using the DocViewer Toolbar to Make Marginal Comments
With the DocViewer toolbar, you can use one of six annotation types for commenting on a student submission.
As shown below in figure three, the highlight annotation is similar to inserting comments in a Microsoft Word document.
In addition to the (2) highlight annotation, the toolbar includes a (1) point annotation, (3) freetext annotation, (4) strikeout annotation, (5) free draw annotation, and (6) area annotation. With the freetext annotation, you can insert a text box (with your comments) over the top of the student’s writing. The free draw annotation is similar to using a pen or pencil to circle, underline, and write on the student’s text. And the area annotation provides a way to insert boxes around certain passages and then make marginal comments.
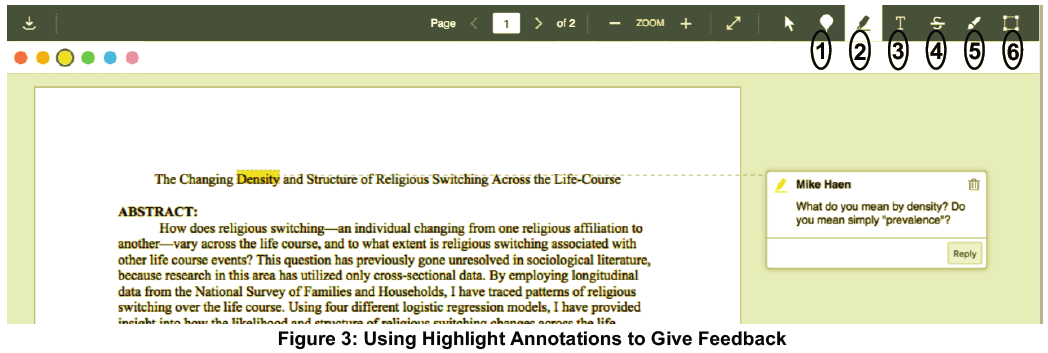
When clicking on the point annotation (#1) and area annotation (#6), a comment box will show up immediately. For the highlight (#2), strikeout (#4), and free draw (#5) annotations, if you want to add a comment box you need to click on the comment box icon that will appear after the initial annotation. You and your students can reply to comments, but only the user who created the comment can delete it. As shown above, you and your students can see the number of pages in a document and can zoom in and out. Note, students might struggle to view annotations on their phones or tablet devices. Encourage them to view annotations on a computer.
IV. Evaluating Assignments with Rubrics in SpeedGrader
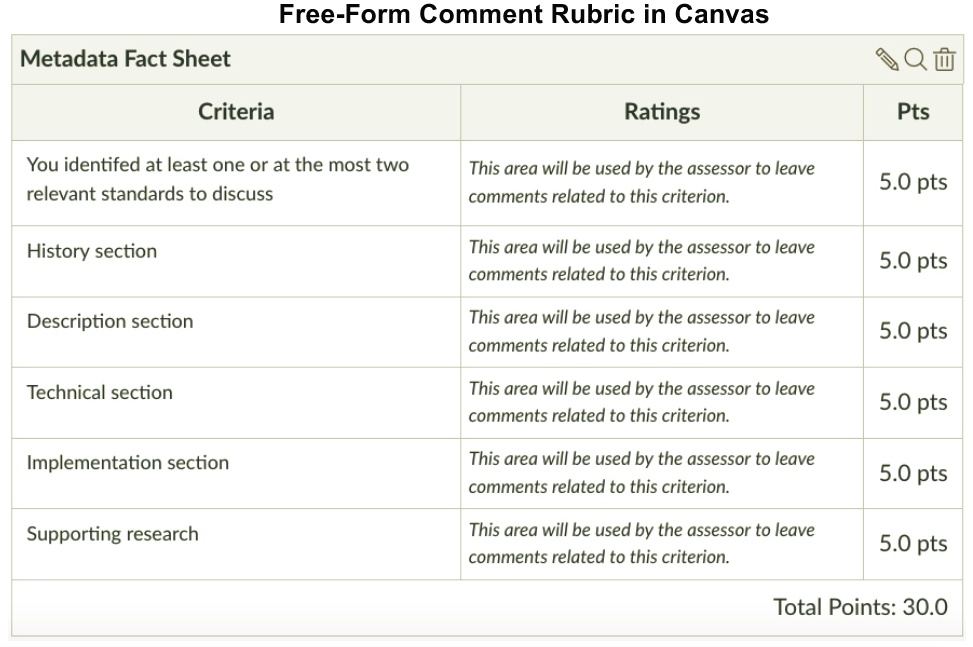
SpeedGrader also supports the use of rubrics when evaluating student writing. When creating and editing any assignment, you can create a rubric or add one that you previously used/saved in Canvas. Below, you’ll see the standard template that is provided when you create a new rubric. The template includes description of criterion for the assignment, corresponding ratings for each criterion, and points earned.
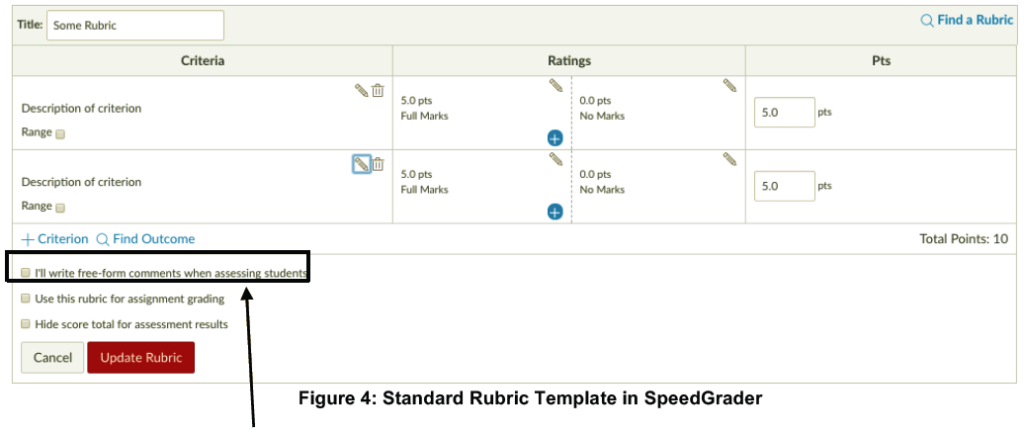
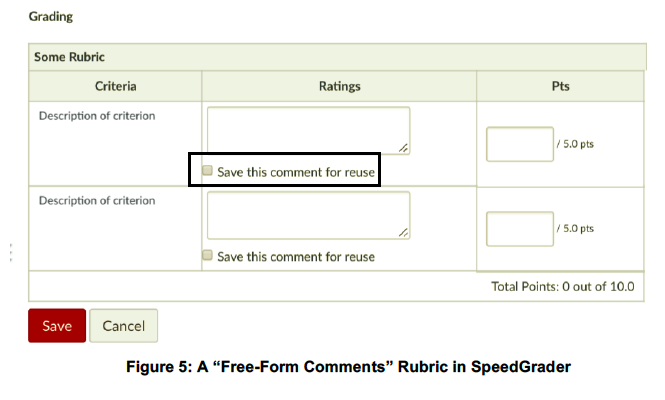
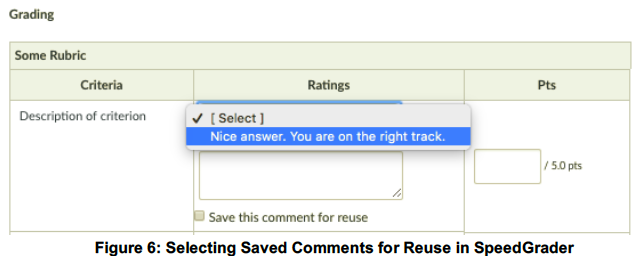
Note the option to “write free-form comments when assessing students.” As shown in Figure 5 below, one of the benefits of using the “free-form comments” rubric is that you have the option to save comments for later use. When typing these free-form comments on student submissions, you will be able to scroll through previously saved comments and add them to student papers, as shown in Figure 6. This feature is especially useful for large lecture courses.
V. A Sample Assignment and Rubric in Canvas
Deb Shapiro, The Information School
LIBRARY & INFORMATION STUDIES (LIS) 646: INFORMATION ARCHITECTURE AND INTERACTION DESIGN
Metadata Fact Sheet Assignment (from Faculty Associate Debra Shapiro)
This exercise is the first component of your group project. Groups will research the metadata standard(s) in use in your selected OI system, and produce a 1-2 page fact sheet. Standards include metadata schemes, sometimes called schema, or element sets; controlled vocabularies, or lists of terms; encoding; and other associated standards. See the week 5 and 6 readings especially Jenn Riley’s Seeing Standards Glossary for guidance on what is a metadata standard.
The first step is for your group to analyze your OI system for standards. These may be existing standards that you will identify using the readings above, or local practices that you observe in your analysis of the system. You may select a single, prominent, standard in use in your system to cover in your fact sheet, or you may cover several standards. I suggest that groups limit to covering two standards at maximum. The purpose of a fact sheet is to present information in a concise, easily consumable way, similar to the executive summary of a lengthy report. Most fact sheets also make use of a visual display of information, such as charts and graphs – you may include these graphics if you wish, it is not required. What is required in your fact sheet is the following sections:
1. History section, that discusses the development of the standard – how long has it been around; what groups of people, organizations, or research community developed the standard; what is the plan for ongoing updates?
2. Descriptive section, that describes the standard and its purpose – the type of resources it is to be used with
3. Technical section, with information about the tags or elements that the standard includes, how it’s commonly encoded, is there software available or does it work with other commonly available software, how to work with or apply the standard; availability of user guides
4. Implementation section, with links to projects that are using the standard, and short descriptions (1 – 2 sentences) of how these implementers are using the standard.
5. Supporting research section, citations to at least two supporting sources, such as articles, book chapters, or websites, that document how the standard is being used; and how it was developed and the reasons it was established.
Once you have gathered your information, lay out your fact sheet as a 1-2 page document, using whatever software you prefer – MSWord or other word processing software is most likely the easiest. It would also be possible to layout the fact sheet in html, then display it in a web browser. Regardless of the software used to create the fact sheet, you’ll need to save it as a .pdf to hand in. There are tons of fact sheet templates available on the Internet, primarily for use with Word or other word processing software. There are also examples – here’s a .pdf of a fact sheet from the US Geological Survey. For this assignment, please hand in your work as a .pdf – this will ensure that your formatting doesn’t get messed up in the upload. On a Mac, you can save almost anything as a .pdf in the print menu, and save as .pdf is built into most versions of MSWord since 2010.